
In today's business world, where data is becoming currency, sales analytics is becoming a key factor for success. Relying solely on intuition and assumptions is risky, while data analysis provides a fact-based view of the effectiveness of strategies and enables process optimization. Let's explore together how to properly understand sales analytics data and apply it in practice.
Choosing the Right Metrics
Selecting the right metrics is the first and, undoubtedly, critical step in building a successful sales analytics strategy. In this chapter, we'll discuss why choosing the right metrics is crucial and which specific indicators are worth considering.
Objective and Key Performance Indicators:
First, define your business goal. This could be increasing profits, expanding your customer base, or improving the overall user experience. Based on this goal, select the key metrics that best reflect its achievement.
Total Sales Volume:
Total sales volume is a fundamental metric that reflects the overall activity of your business. This metric provides insight into the success of your marketing efforts and the demand for your products or services.
Average Check:
The average order value is the average amount a customer spends on a single purchase. It helps evaluate the effectiveness of average order value-increasing strategies, such as cross-selling and upselling.
Conversion Rates:
Conversion rates measure how successfully visitors to your website or app complete targeted actions, such as making a purchase, subscribing, or registering. These metrics help you understand the effectiveness of your user experience.
Marginality:
Marginality reflects the difference between total revenue and variable costs. It is a key indicator for understanding the profitability of each individual sale and the overall profitability of a business.
Refunds and Cancellations:
Metrics related to returns and order cancellations are important for assessing customer satisfaction and the quality of products or services provided.
Customer Lifetime Value (LTV):
LTV represents the expected revenue from a customer over the entire relationship. This metric is especially important for assessing the long-term value of each customer to your business.
ROI (Return on Investment):
ROI measures the effectiveness of your marketing and advertising campaigns by showing how successful they are in generating profit compared to their costs.
Customer Behavior Tracking:
Tracking important customer behavior metrics like time on site, page views, and content engagement helps you understand what attracts your customers and which strategies produce the best results.
Personalized Metrics:
Depending on the nature of your business and its specifics, consider creating customized metrics that best reflect your unique goals and objectives.
Integrating Metrics into Problem Solving:
It's important to remember that the purpose of metrics isn't just observation, but decision-making. Integrate sales analytics into your decision-making processes so that the results lead to concrete actions to improve performance. Choosing the right metrics is a key step in building a successful sales analytics strategy. Define your business goals, select the metrics that best reflect them, and use them to make informed decisions. Remember, sales analytics isn't just about numbers; it's about understanding how they relate to your business goals and what actions they imply for further development.
Using Analytics Tools
Analytics tools are incredibly powerful tools for understanding how your customers interact with your business. In this chapter, we'll cover several key analytics tools that will help you gain valuable insights into customer behavior.
Google Analytics: Comprehensive Web Traffic Analysis
Google Analytics — is a fundamental tool for web traffic analysis. Here's how it can help you understand your customers:
- Visitor Tracking: Google Analytics provides information about the number of visitors, their location, the devices they use, and the time they spend on your site.
- Website Behavior Analysis: You can study which pages your customers visit, how long they stay on each page, and at what points they leave your site. This will help you optimize the user experience.
- Goal and Conversion Tracking: Google Analytics allows you to set goals and track conversions, such as purchases, form completions, or newsletter signups.
Hotjar: User Behavior Visualization
Hotjar Provides visual analysis of how users interact with your website. Key features include:
- Tracking Cursor Movement and ClicksHotjar lets you see where users move their cursor and what they click. This helps you identify the most engaging elements on your page.
- User Session Recordings: The ability to view recordings of user sessions to understand how they interact with various site elements in real time.
- Surveys and Feedback: Hotjar provides tools for conducting surveys and collecting user feedback, which provides additional insights into their opinions of the site.
Mixpanel: Event and Funnel Analysis
Mixpanel is a tool focused on analyzing events and conversion funnels. Mixpanel offers the following features:
- Event Tracking: Analyze specific events on your website or app, such as button clicks, video views, or adding items to carts.
- Funnel Analysis: Create and analyze conversion funnels to identify the stages where users are most likely to drop off.
- User Segmentation: Divide users into groups with common characteristics to analyze each group's behavior in more depth.
Crazy Egg: Visual Analysis of Hot and Cold Zones
Crazy Egg provides visual reports that help you understand how users interact with your site through heatmaps and other tools:
- Heat Maps: Displaying "hot" and "cold" zones on website pages, which helps
determine which areas users focus their attention on. - Scroll Cards: Visualize how far users scroll on each page, helping optimize content placement.
- Click Analysis: Track clicks on different elements of a page to understand which elements attract the most attention.
Integrating Tools: Gaining a Comprehensive Vision
Integrating all these tools into one system provides a comprehensive view of customer interactions with your business. For example, data from Google Analytics can be used in Mixpanel for additional analysis of conversions and events.
CRM System Integration: A Key Element in Business Process Optimization
In the era of digital transformation, effective customer relationship management (CRM) is becoming an integral component of a successful business. However, the maximum benefit from a customer relationship management system can only be realized through its integration into the overall enterprise structure. Let's consider why CRM system integration is a key element in optimizing business processes.
1. Unified Data Warehouse
CRM system integration allows you to create a unified, centralized repository of customer data. This eliminates duplication of information, reduces the likelihood of errors, and ensures a single source of truth for the entire business. Every department, from marketing to sales and customer service, has access to up-to-date information.
2. Improving the Sales Process
An integrated CRM system combines information about leads, clients, and deals. This allows for balanced sales funnel management, identifying successful strategies, and optimizing steps that can lead to conversion. Automating certain stages of a deal accelerates the sales process and increases salesperson efficiency.
3. Increased Customer Satisfaction
Integrated CRM systems enable personalized service delivery to customers. By understanding their preferences, purchase history, and requests, businesses can more accurately tailor their offerings and provide personalized service. This, in turn, promotes customer satisfaction and repeat business.
4. Analytics and Forecasting
Integrated CRM systems enrich business analytics. Managers gain access to in-depth data analysis, can identify trends, evaluate campaign effectiveness, and forecast future sales. This enables them to make more informed strategic decisions.
5. Connection with Other Tools
Integrating a CRM system with other tools, such as email, social media, and marketing automation systems, creates a harmonious ecosystem. This simplifies customer interactions across various platforms and creates a unified space for collaboration.
6. Effective Communication Management
Integrated CRM systems improve internal communication. Employees can quickly share client information, discuss strategies, and coordinate efforts to achieve shared goals. This facilitates more flexible and effective project management.
CRM system integration is more than just implementing a customer management tool. It's also the creation of a centralized data and process management system that spans the entire company. A properly configured and integrated CRM system becomes a driver for business process optimization, ultimately driving sales growth, improving customer service, and providing a competitive advantage in the marketplace.
Analytics-Driven Decision Making:
- Page Optimization: Use analytics data to optimize your web pages based on customer behavior.
- Personalized Content: Create personalized content based on an analysis of customer preferences and interests.
- Improving Advertising Performance: Optimize your advertising campaigns based on information about which channels drive the most conversions.
- Adaptation of Products and Services: Use product usage data to adapt and improve products to meet customer needs.
Using analytics tools allows you to gain valuable insights into customer behavior, which in turn opens up opportunities to optimize business processes, create more effective marketing strategies, and improve customer satisfaction. By combining various tools, you gain a comprehensive understanding of how your customers interact with your brand, a key element of successful sales management.
3. Sales Funnel Analysis
A sales funnel is an essential analytical tool that allows you to understand how users interact with your product from initial contact to completion. Let's explore why sales funnel analysis is so important and how it can help you.
Definition of Funnel Stages:
The first step is to clearly define the stages of the sales funnel. This may include phases such as visiting a website, exploring products, adding items to a cart, placing an order, and finally, successfully completing the purchase.
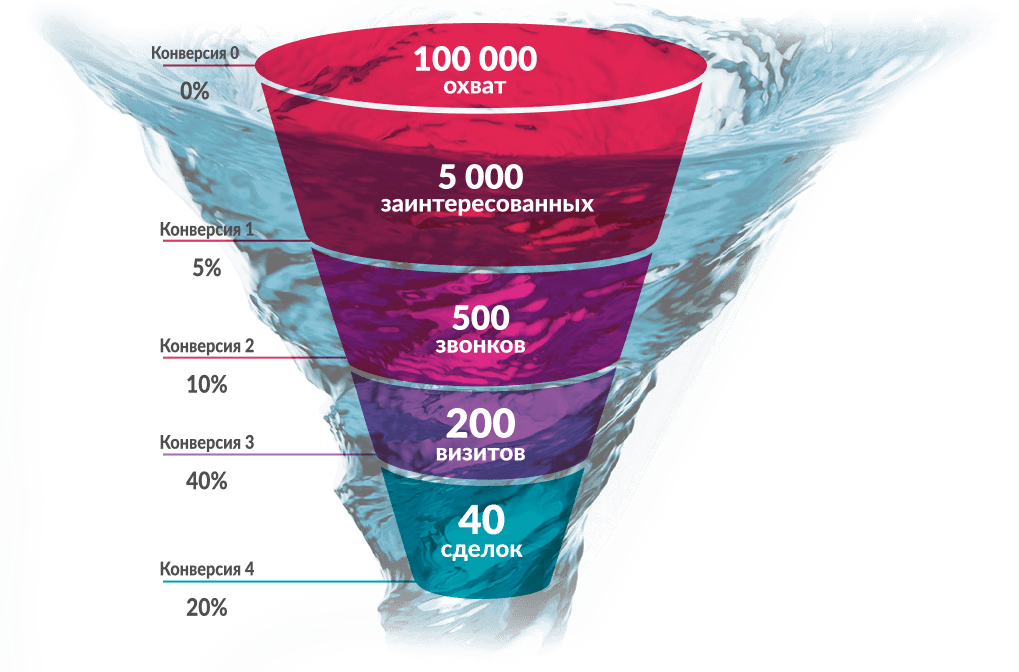
Identifying Cutoff Points:
Analyze data to identify points where users drop off. This could be, for example, when placing an order or viewing product details. Identifying these points allows you to focus your efforts on improving them.
Conversion Rate Between Stages:
Measure conversions between each stage of the funnel. For example, what percentage of website visitors register and then make a purchase? This information can help you understand where you're experiencing the biggest losses and what you need to focus on.
User Behavior Analysis:
Monitor user behavior at every stage. Which pages do they spend the most time on? Which elements attract their attention? This analysis can reveal your website's strengths and weaknesses and help you optimize it for maximum effectiveness.
Marketing Channels Effectiveness:
Use a sales funnel to evaluate the effectiveness of various marketing channels. Track where your visitors come from and which of these sources lead to the highest conversions. This will help you allocate your budget across channels more effectively.
Implementing Improvements:
Based on the data collected from your sales funnel analysis, develop and implement improvements. These could include changes to the user interface, optimized checkout pages, or improved product information. Remember that even small changes can significantly increase conversion.
Regular Funnel Updates:
A sales funnel isn't static. Regularly update your model to reflect changes in the market environment, consumer behavior, and your strategy. This will help you remain responsive and adapt to new challenges.
Sales funnel analysis is a powerful tool for understanding how users interact with your product. Using this tool, you can optimize every stage of the customer journey, increasing conversions and ensuring more efficient operation of your business.
4. Customer Segmentation
Customer segmentation allows you to more accurately understand the needs of different audience groups. Analyzing sales by segment helps you adapt marketing strategies and provide more personalized service. Customers will appreciate it when you demonstrate that you understand their individual needs.
How to Segment:
- Demographic Segmentation: Divide customers by characteristics such as age, gender, income, education, and location. This data can be key when defining target audiences.
- Behavioral Segmentation: Analyze how customers interact with your product or service. Include purchases, website visits, reviews, and other actions in this analysis.
- Geographic Segmentation: Consider customer location. This can be useful when adapting marketing strategies to regional characteristics and needs.
- Interest Segmentation: Study your customers' interests and preferences. This may include analyzing purchases, website click-through rates, loyalty program participation, and other aspects.
Applying Segmentation Results:
- Personalized Content: Create content that meets the unique needs of each segment. This could include customized offers, promotions, or advertising materials.
- Targeted Advertising: Target your advertising campaigns to specific segments to improve their effectiveness.
- Improving CommunicationApproach each segment based on how they interact with your brand. This will facilitate more effective communication and strengthen your relationships with customers.
Regular Segmentation Updates:
Segmentation isn't static. Update your segments regularly to reflect changes in customer behavior and needs, as well as new data that becomes available.
5. Forecasting and Planning
Based on analytical data, future sales forecasts can be created. This allows for better inventory planning, production load forecasting, and tailoring of marketing campaigns. Regularly updating forecasts ensures adaptation to the changing business environment.
Forecasting and planning are crucial steps that allow a business not only to understand the current situation but also to prepare for future challenges. In this chapter, we'll explore how sales analytics can be used to create forecasts and develop strategic plans.
Using Historical Data:
Historical data analysis is the basis for forecasting. Results from previous periods allow us to identify trends, seasonal fluctuations, and factors influencing sales. This forms the basis for developing future forecasts.
Forecasting Models:
- Time Series: They are used to forecast changes over time, allowing for seasonal fluctuations and cyclical trends to be taken into account.
- Regression Analysis: Allows you to evaluate the impact of various factors on sales and predict future values.
- Machine Learning: Machine learning algorithms such as neural networks and random forest algorithms can be used to create more complex models that take into account multiple variables.
Demand Forecasting:
Forecasting demand for goods or services is a key element of effective inventory and production management. Sales analytics helps answer questions such as: What products will be in demand? In what quantities? And when?
Marketing Campaign Planning:
Sales forecasting also plays a vital role in planning marketing campaigns. Knowing expected sales volumes allows companies to determine optimal promotion channels, budgets, and strategies to maximize campaign effectiveness.
Resource Management:
Sales analytics helps optimize resource utilization. Based on forecasts, companies can plan purchases, production processes, and personnel, avoiding excess spending or resource shortages.
Scenario Planning:
Developing various scenarios based on forecasts allows businesses to be prepared for various future scenarios. This is especially important in a rapidly changing business environment.
Control of Plan Execution:
Forecasting isn't just about predicting the future, it's also a tool for monitoring plan execution. Comparing actual data with forecasts allows us to identify discrepancies and adjust strategies.
6. Analysis of Marketing Campaign Effectiveness
Tracking the effectiveness of marketing campaigns is one of the most important tasks of sales analytics. Assessing ROI, studying conversions from various channels, and identifying the best advertising platforms all help you use your marketing budget most effectively.
Defining Key Metrics:
- ROAS (Return on Advertising Spend): This metric measures the profit generated from advertising spend. Determining ROAS helps you understand the effectiveness of each advertising campaign.
- Conversion Rates: Analyzing conversion rates for different stages of the sales funnel helps determine at which stage customers most often make a purchase decision.
- CAC (Customer Acquisition Cost): Customer acquisition cost is an important metric that helps you estimate how much it costs to attract a new customer.
- LTV (Customer Lifetime Value): Understanding how much profit one client generates over the entire relationship allows you to determine the profitability of investing in customer retention.
Conclusion
The field of sales analytics is constantly evolving, and successful companies understand that staying on top of trends and innovating is key to their competitiveness. The future belongs to those who can not only collect data but also extract valuable insights for strategic decision-making.
Unraveling the mysteries of numbers is an art that requires not only technical mastery but also intuition, an understanding of the business context, and the ability to see beyond the numbers.